The Gibbs program was used to simulate the properties of pure fluorine. The values
of Epsilong/K and Sigma were obtained from
[3] which are as follows:
Epsilon/K = 52.8 K
Sigma = 2.825 Angstrom
The experimental data were obtained from
" IUPAC International Thermodynamic Tables of the Fluid State. " Vol 11
Simulations were done in the 90 to 130 K range. Temperatures lower than 90 K do not give enough particle transfers. Temperatures greater than 130K are too close to the critical point (144.3 K).
Summary of results are given below.
        Atomic Weight :  18.998403   g/mol
 Critical Temperature :  144.3	K
	Melting point :  53.5	K
	Boiling point :  85     K
| T(K) |
Gibbs Liquid Density (kg/m3) |
Gibbs Vapor Density (kg/m3) |
Experimental Liquid Density (kg/m3) |
Experimental Vapor Density (kg/m3) |
| 90 |
1435.85 ± 27.137 |
6.492 ± 1.481 |
1466.322 |
9.244 |
| 95 |
1412.61 ± 6.538 |
14.926 ± 1.047 |
1429.002 |
14.446 |
| 100 |
1373.72 ± 12.190 |
19.202 ± 1.190 |
1389.99 |
21.494 |
| 105 |
1332.02 ± 10.818 |
28.842 ± 1.988 |
1348.82 |
31.012 |
| 110 |
1280.95 ± 7.694 |
39.985 ± 1.579 |
1305.19 |
43.338 |
| 115 |
1253.89 ± 8.162 |
88.468 ± 8.228 |
1258.31 |
59.483 |
| 120 |
1201.65 ± 4.973 |
89.782 ± 4.456 |
1207.40 |
80.165 |
| 125 |
1130.41 ± 16.841 |
105.165 ± 3.384 |
1150.38 |
107.502 |
| 130 |
1052.35 ± 23.343 |
143.251 ± 3.816 |
1084.79 |
143.715 |
The actual data and results files from the simulations are kept. The density plots for each run are also presented.
Using these values, a new set of fitted epsilon/k and sigma is obtained :
Epsilon/k = 52.946 K
sigma = 2.812 A
Click here to
see the method used to obtain the fitted parameters.
The coexistence plot for Fluorine obtained from the fitted values of epsilon/k and sigma is presented below.

Vapor Pressure of Fluorine.
The results from the Gibbs simulation also included the vapor pressure of the two phases. The values are compared to that of the experiment (also obtained from IUPAC).
| T(K) |
P liquid Gibbs (bar) |
P gas Gibbs (bar) |
P experiment (bar) |
| 90 |
2.592 ± 5.604 |
1.237 ± 0.279 |
1.729 |
| 95 |
3.057 ± 8.298 |
2.935 ± 0.196 |
2.798 |
| 100 |
2.117 ± 4.940 |
3.909 ± 0.237 |
4.275 |
| 105 |
7.515 ± 6.398 |
6.013 ± 0.399 |
6.290 |
| 110 |
7.590 ± 3.256 |
8.474 ± 0.376 |
8.891 |
| 115 |
16.471 ± 3.382 |
16.517 ± 0.951 |
12.229 |
| 120 |
18.881 ± 2.341 |
17.984 ± 0.694 |
16.342 |
| 125 |
20.917 ± 6.591 |
21.671 ± 0.446 |
21.410 |
| 130 |
27.713 ± 5.199 |
28.240 ± 0.482 |
27.475 |
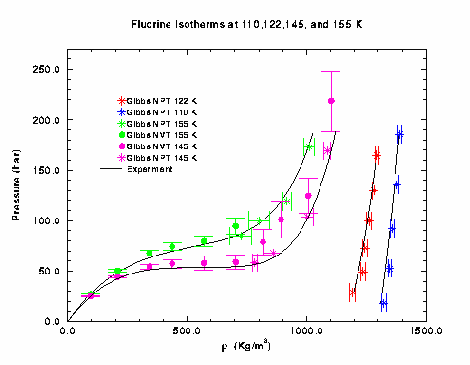
Fluorine Isotherms.
The Gibbs simulation (NVT and NPT) was used to map out the isotherms at
110, 122, 145, and 155 K (the critical temperature is at 144.3 K). The Gibbs
NVT program gave good results at densities lower than about 700 Kg/m3, and
the Gibbs NPT program was used to obtain values at higher densities.
For the NVT simulation, two results could be obtained from each simulation.
However, only one could be obtained from the NPT simulation. Input and result
files of each run are listed below. Only the first value in each catagory of the
NPT files is valid.
The graph below shows a summary of the results obtained from the Gibbs simulation.
Click for
more plots of isotherms. or
Input and Result files.